✦ Back to Homepage


Making sense scary-high cost estimates into transparent forecast
My Roles:
Product Designer
Team:
PM, Solution Architects, Sales Ops, Designer, and Engineering
Timeline:
2025 (3 months)
Context
I redesigned cost estimation that is generating scary-high cost, into an explainable, data-driven forecast.
Game studios who interested to onboard with AccelByte services, they need to evaluate backend & server orchestration costs in our pricing calculator to estimate their infrastructure usages based on the game’s Peak Concurrent Users (PCCU).
problem
The old pricing calculator asked users to enter PCCU directly. For many game studios, especially early stage, this is an abstract metric, Peak Concurrent Users (PCCU) is hard to estimate in isolation.
Goal
How might we make it explainable by helping customers estimate the cost that makes sense?
Define success metrics:
- Lowering drop-off on the pricing calculator page.
- Increasing the “Download Estimate” conversions.
- Let users compare cost to revenue to judge margin impact.
- Contact Sales CTA after realistic estimates.
The “Why” behind the number
People are more certain about Monthly Active Users (MAU). The context can generates a more measured PCCU.
Contextual benchmaring
Introduce a MAU-to-PCCU ratio (with common ranges) makes the relationship visible and adjustable.
Financial context
Compare AccelByte spend to user’s revenue to understand margin impact by showing Cost as % of Revenue.
Guardrail the extremes
Offer "Talk to Sales" guidance when estimates reach extreme scales.
Strategic Framing
Instead of asking, "What is your PCCU?", the UI should ask:
"How many players do you expect to have online at the same time during your busiest hour?"
Solutions
We simplified the technical complexity by grounding the calculator in business-centric language and industry benchmarks.
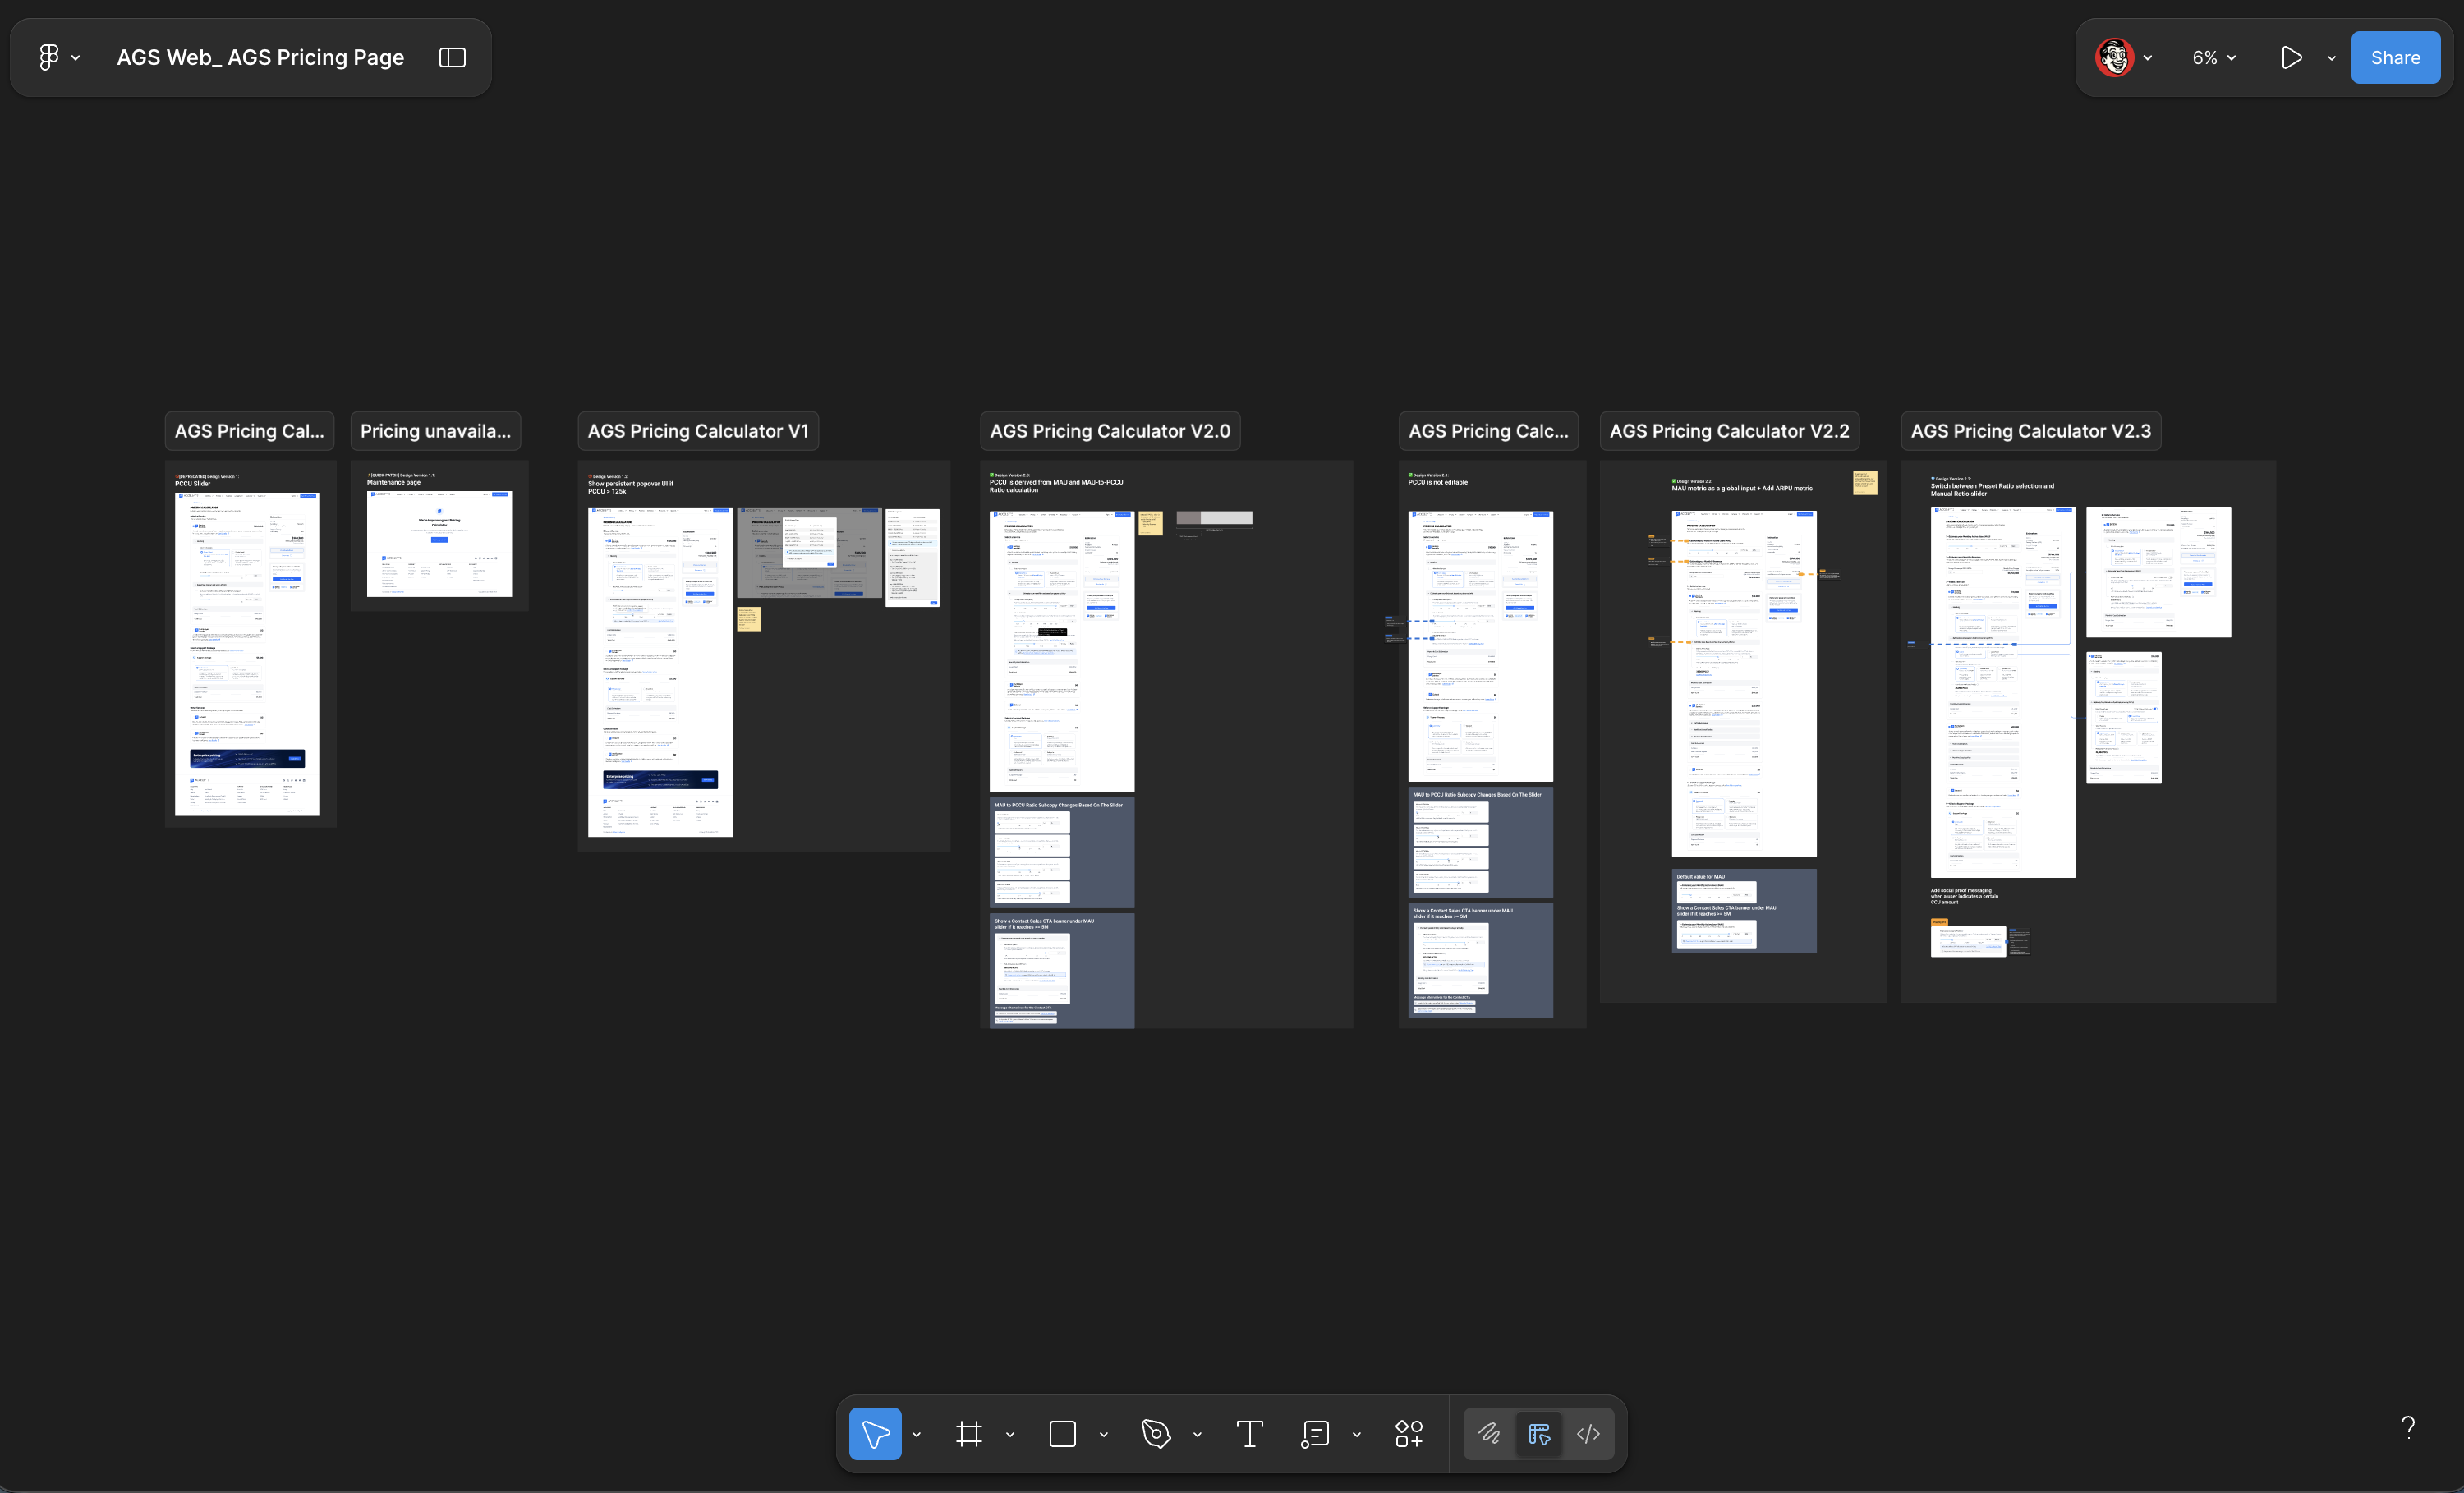
Design Process
Here’s how the design evolves with countless iterations.
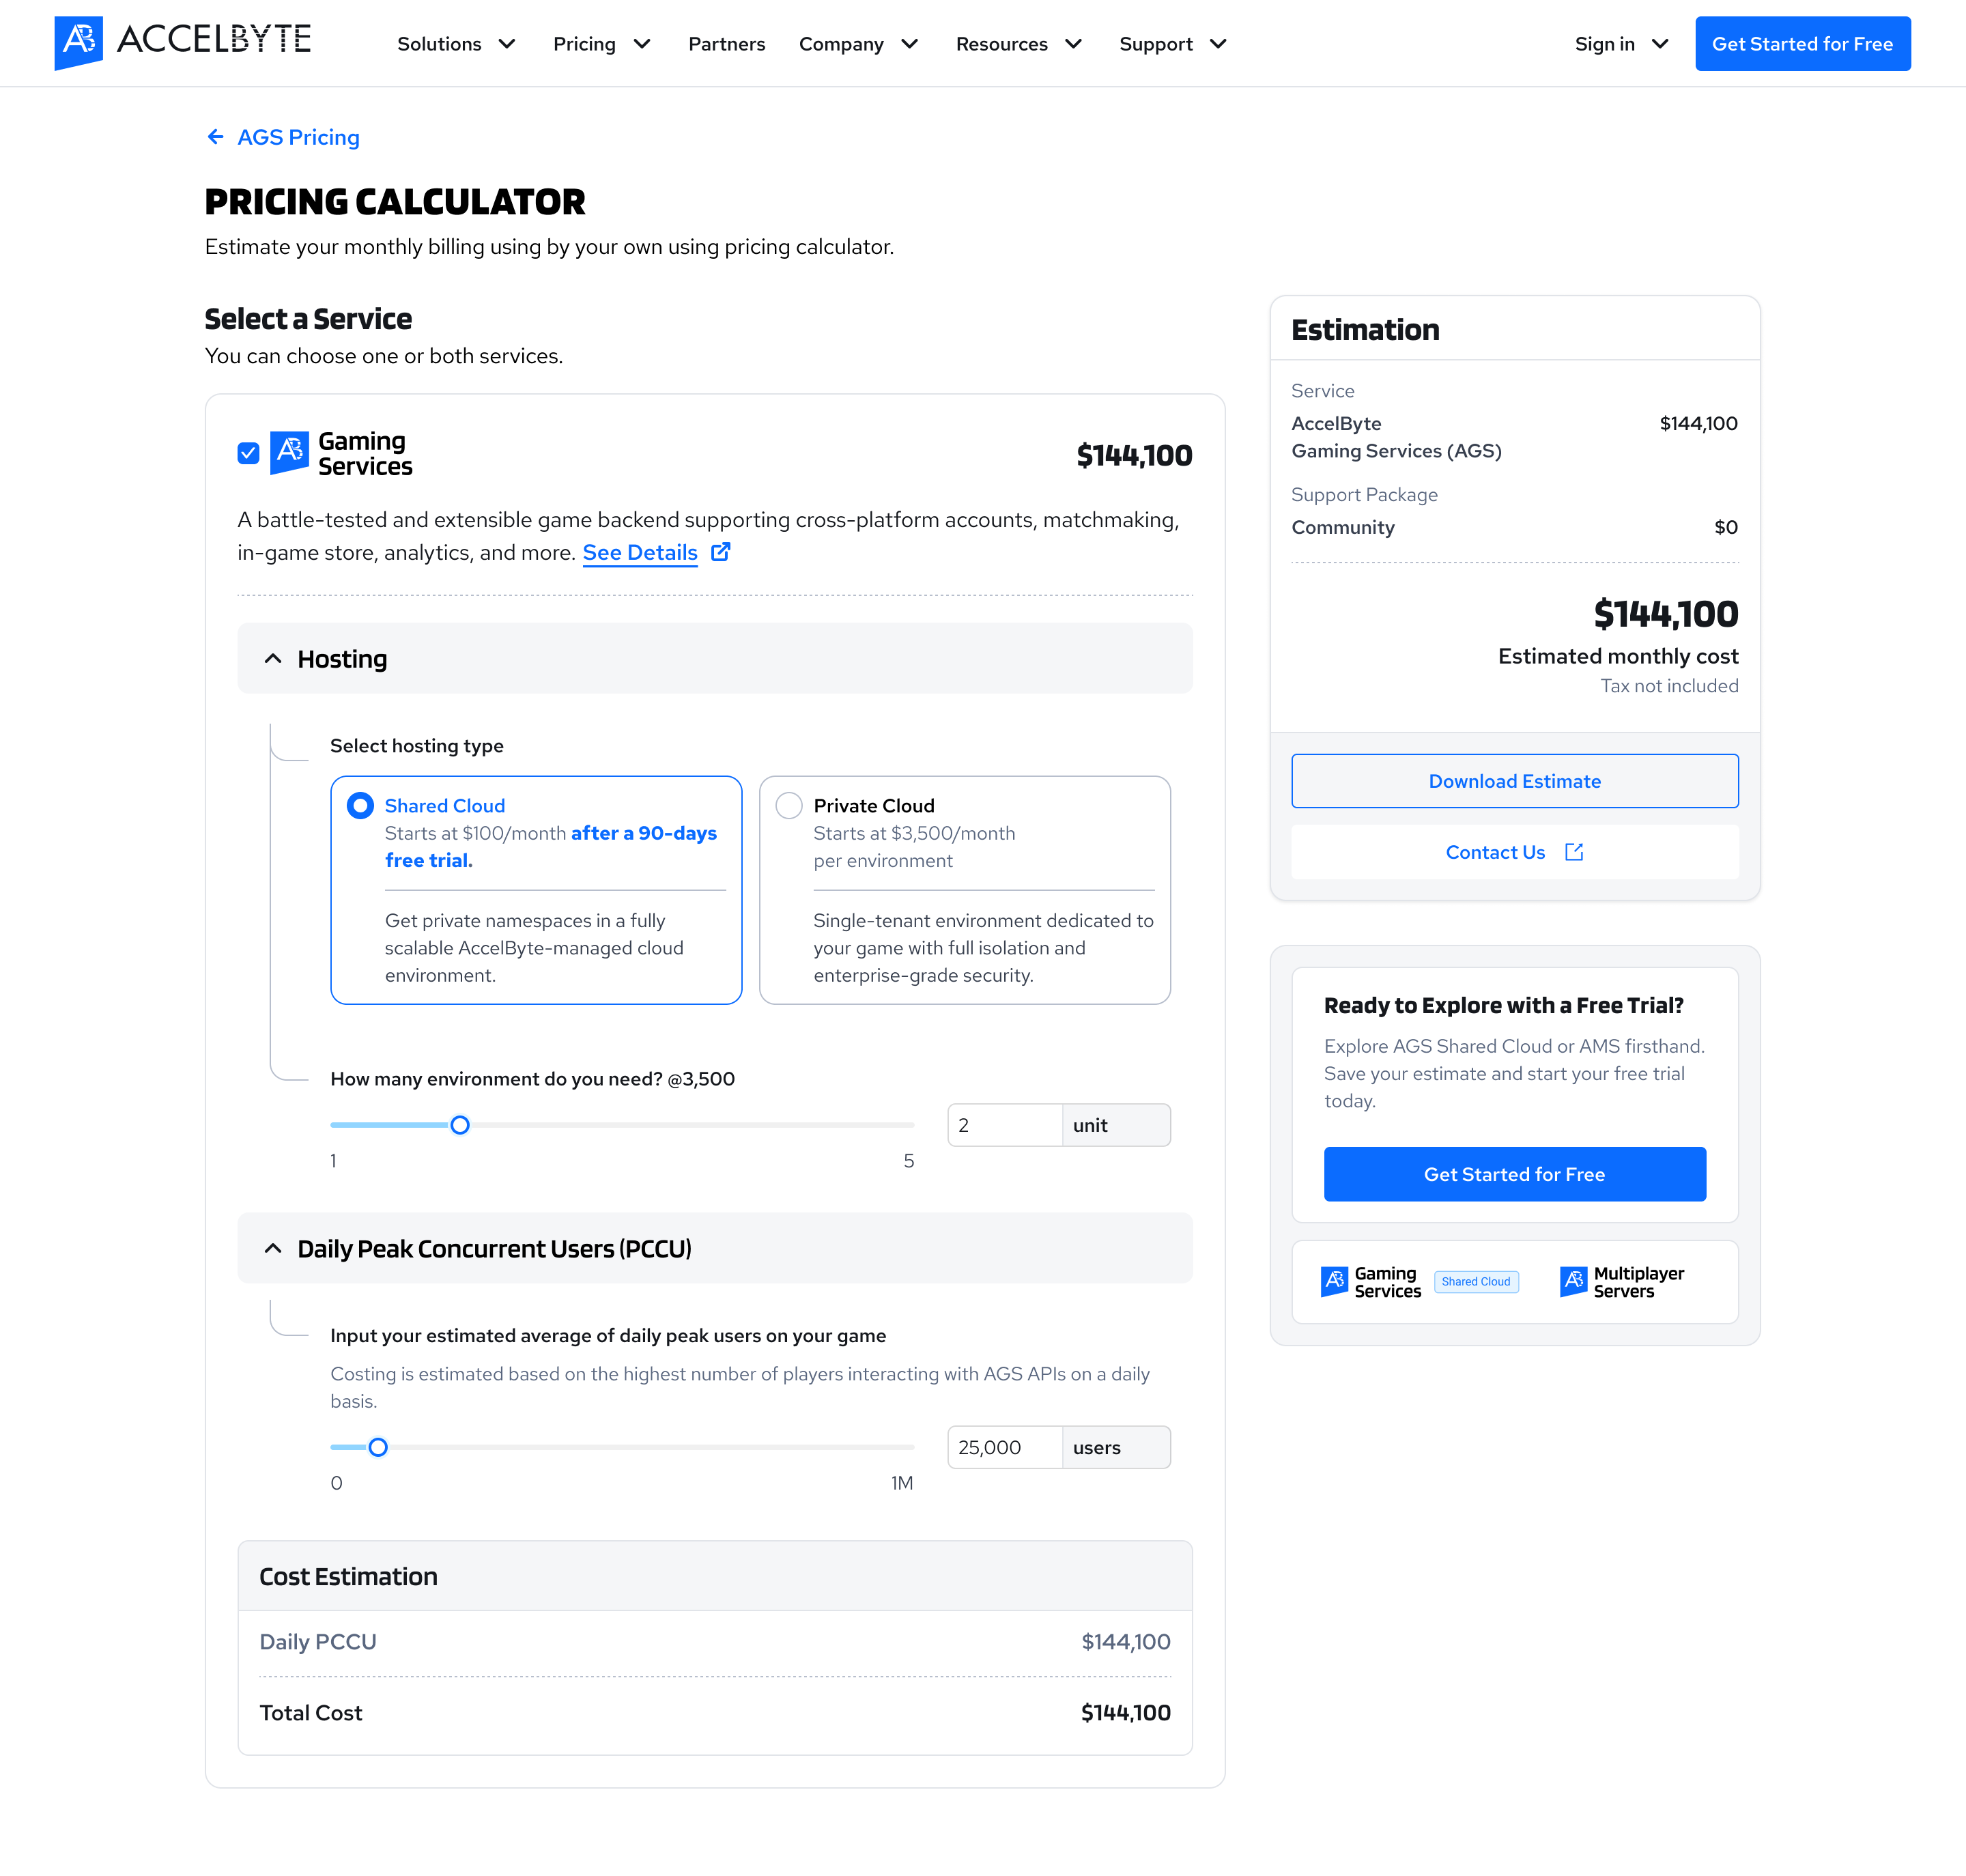
The Problematic Design
While the interaction only requires adjusting a single slider, the resulting PCCU spikes can result in high, 'scary' cost projections that causes user drop-off.
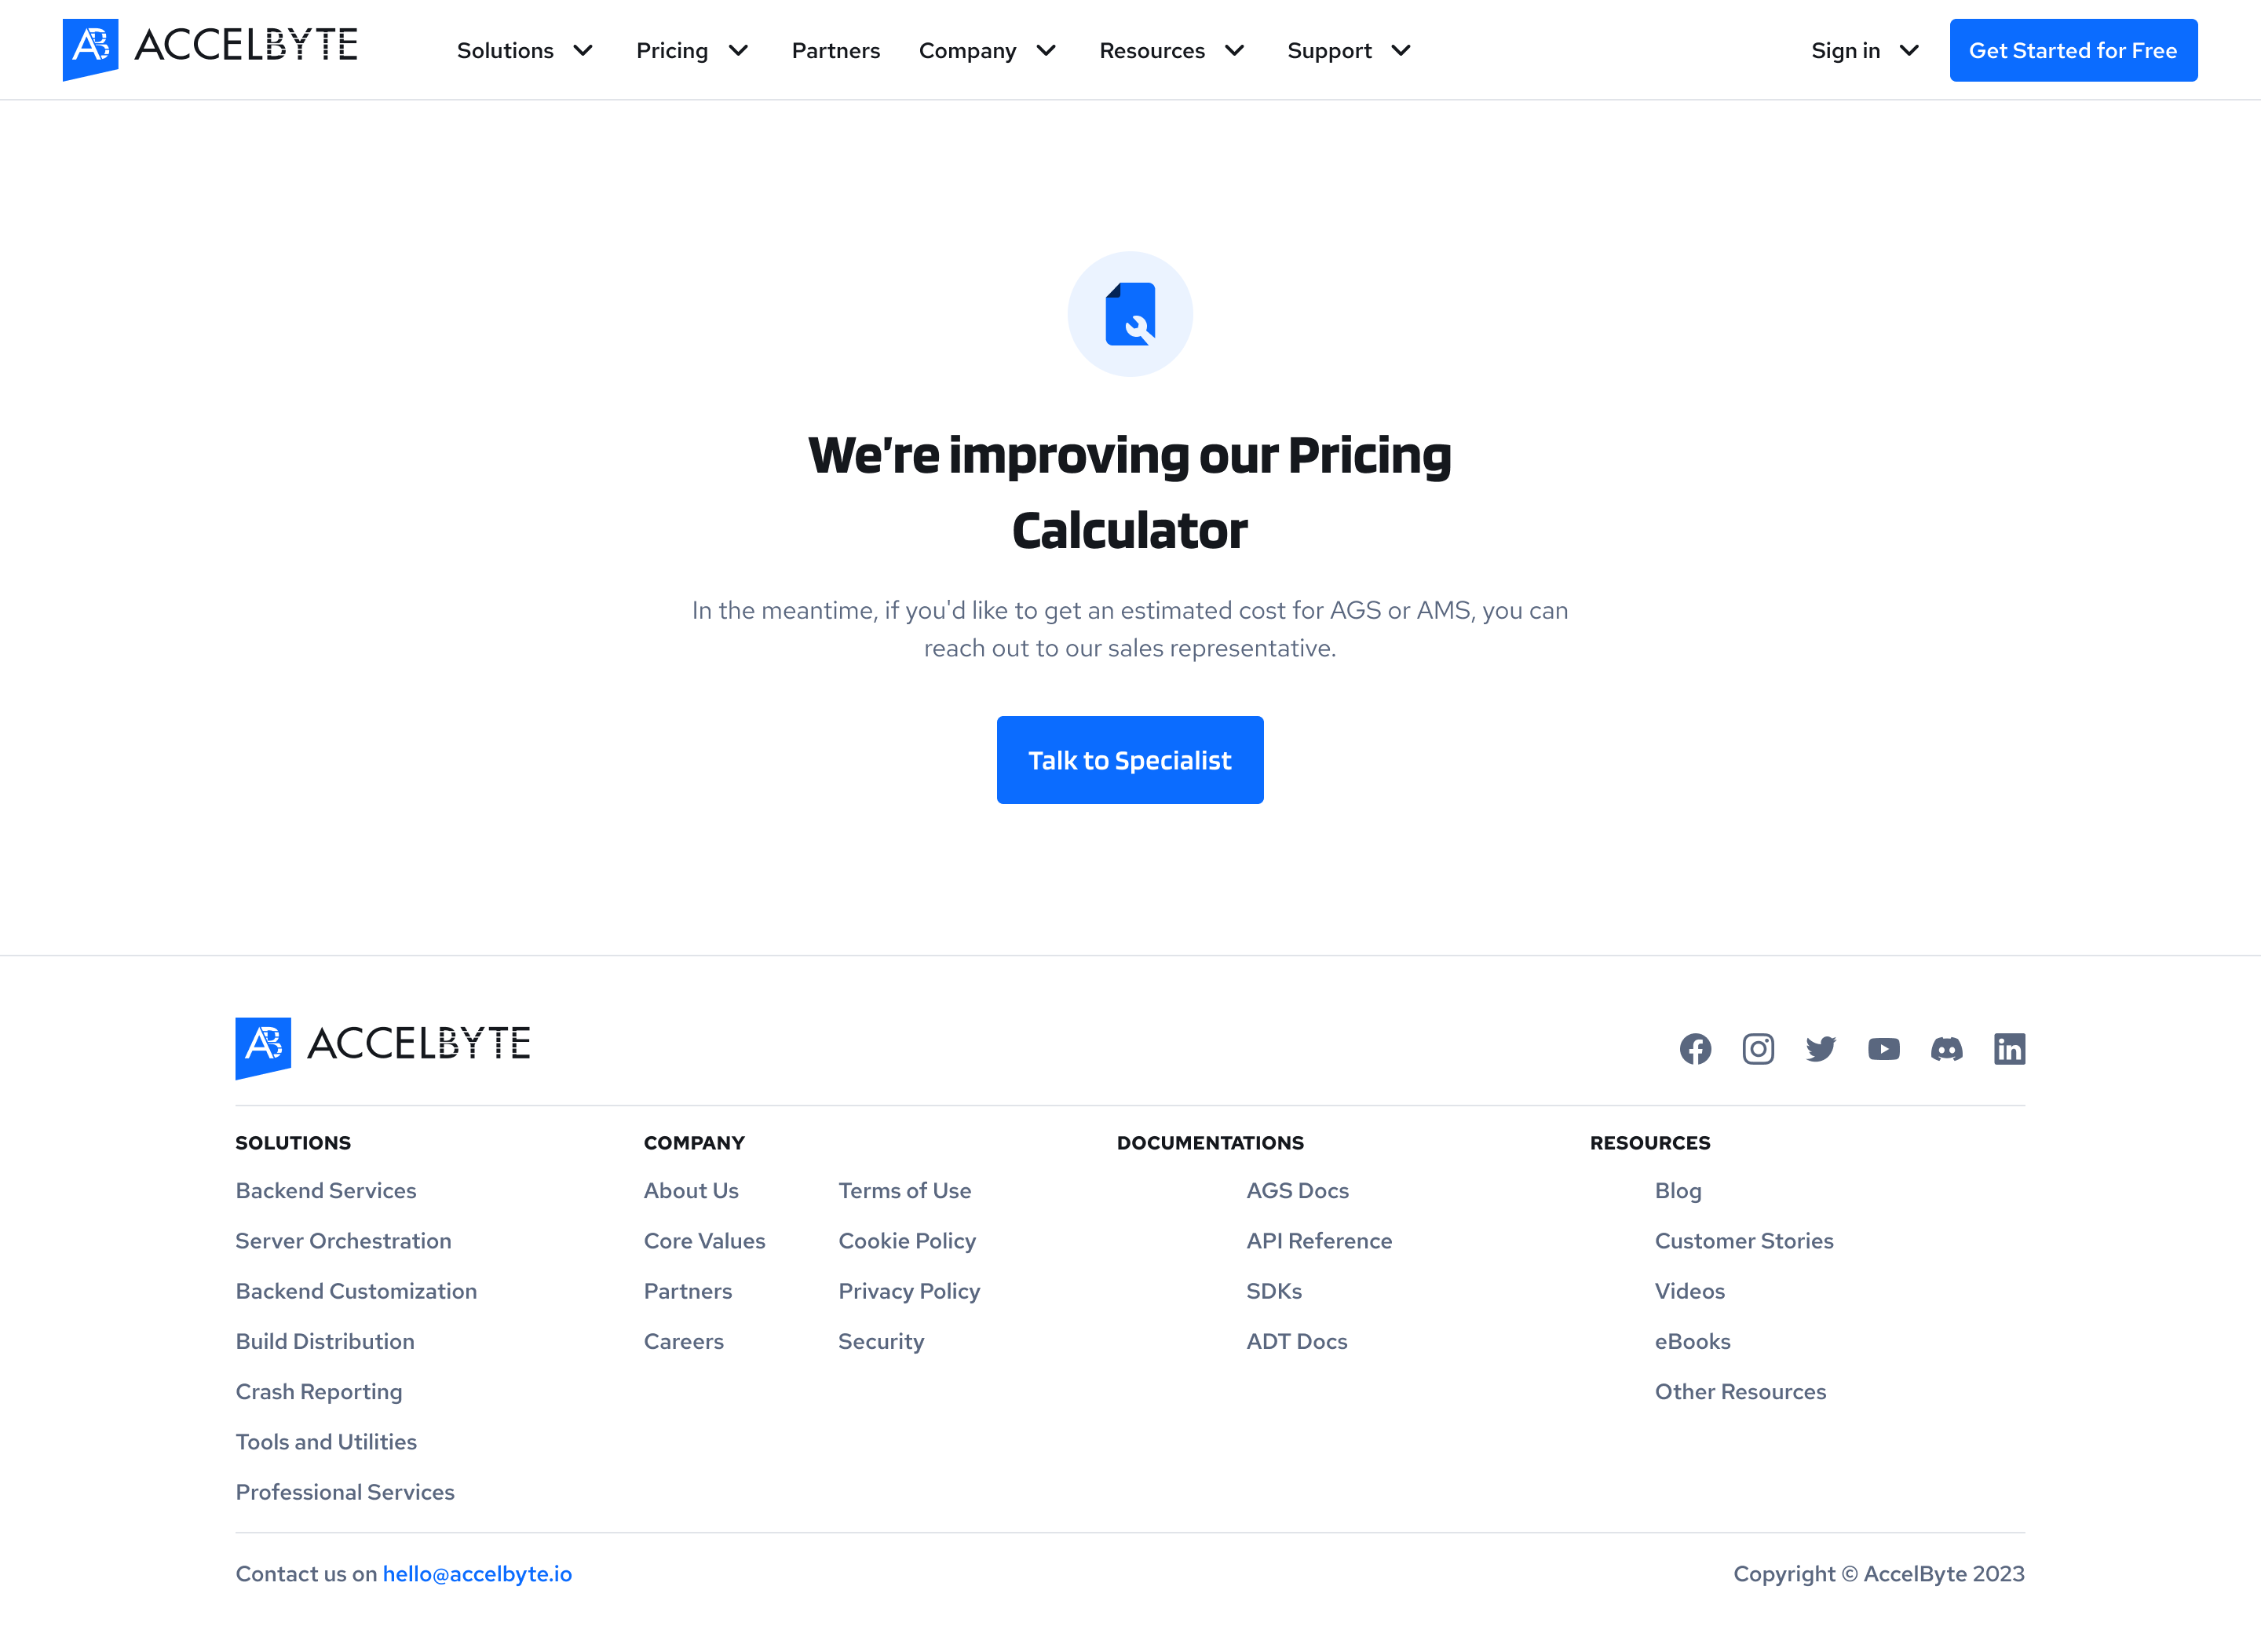
V0 - Temporarily Hide from Public
We temporarily hide the pricing calculator from public to avoid more damage caused, while we’re cooking the improved version.
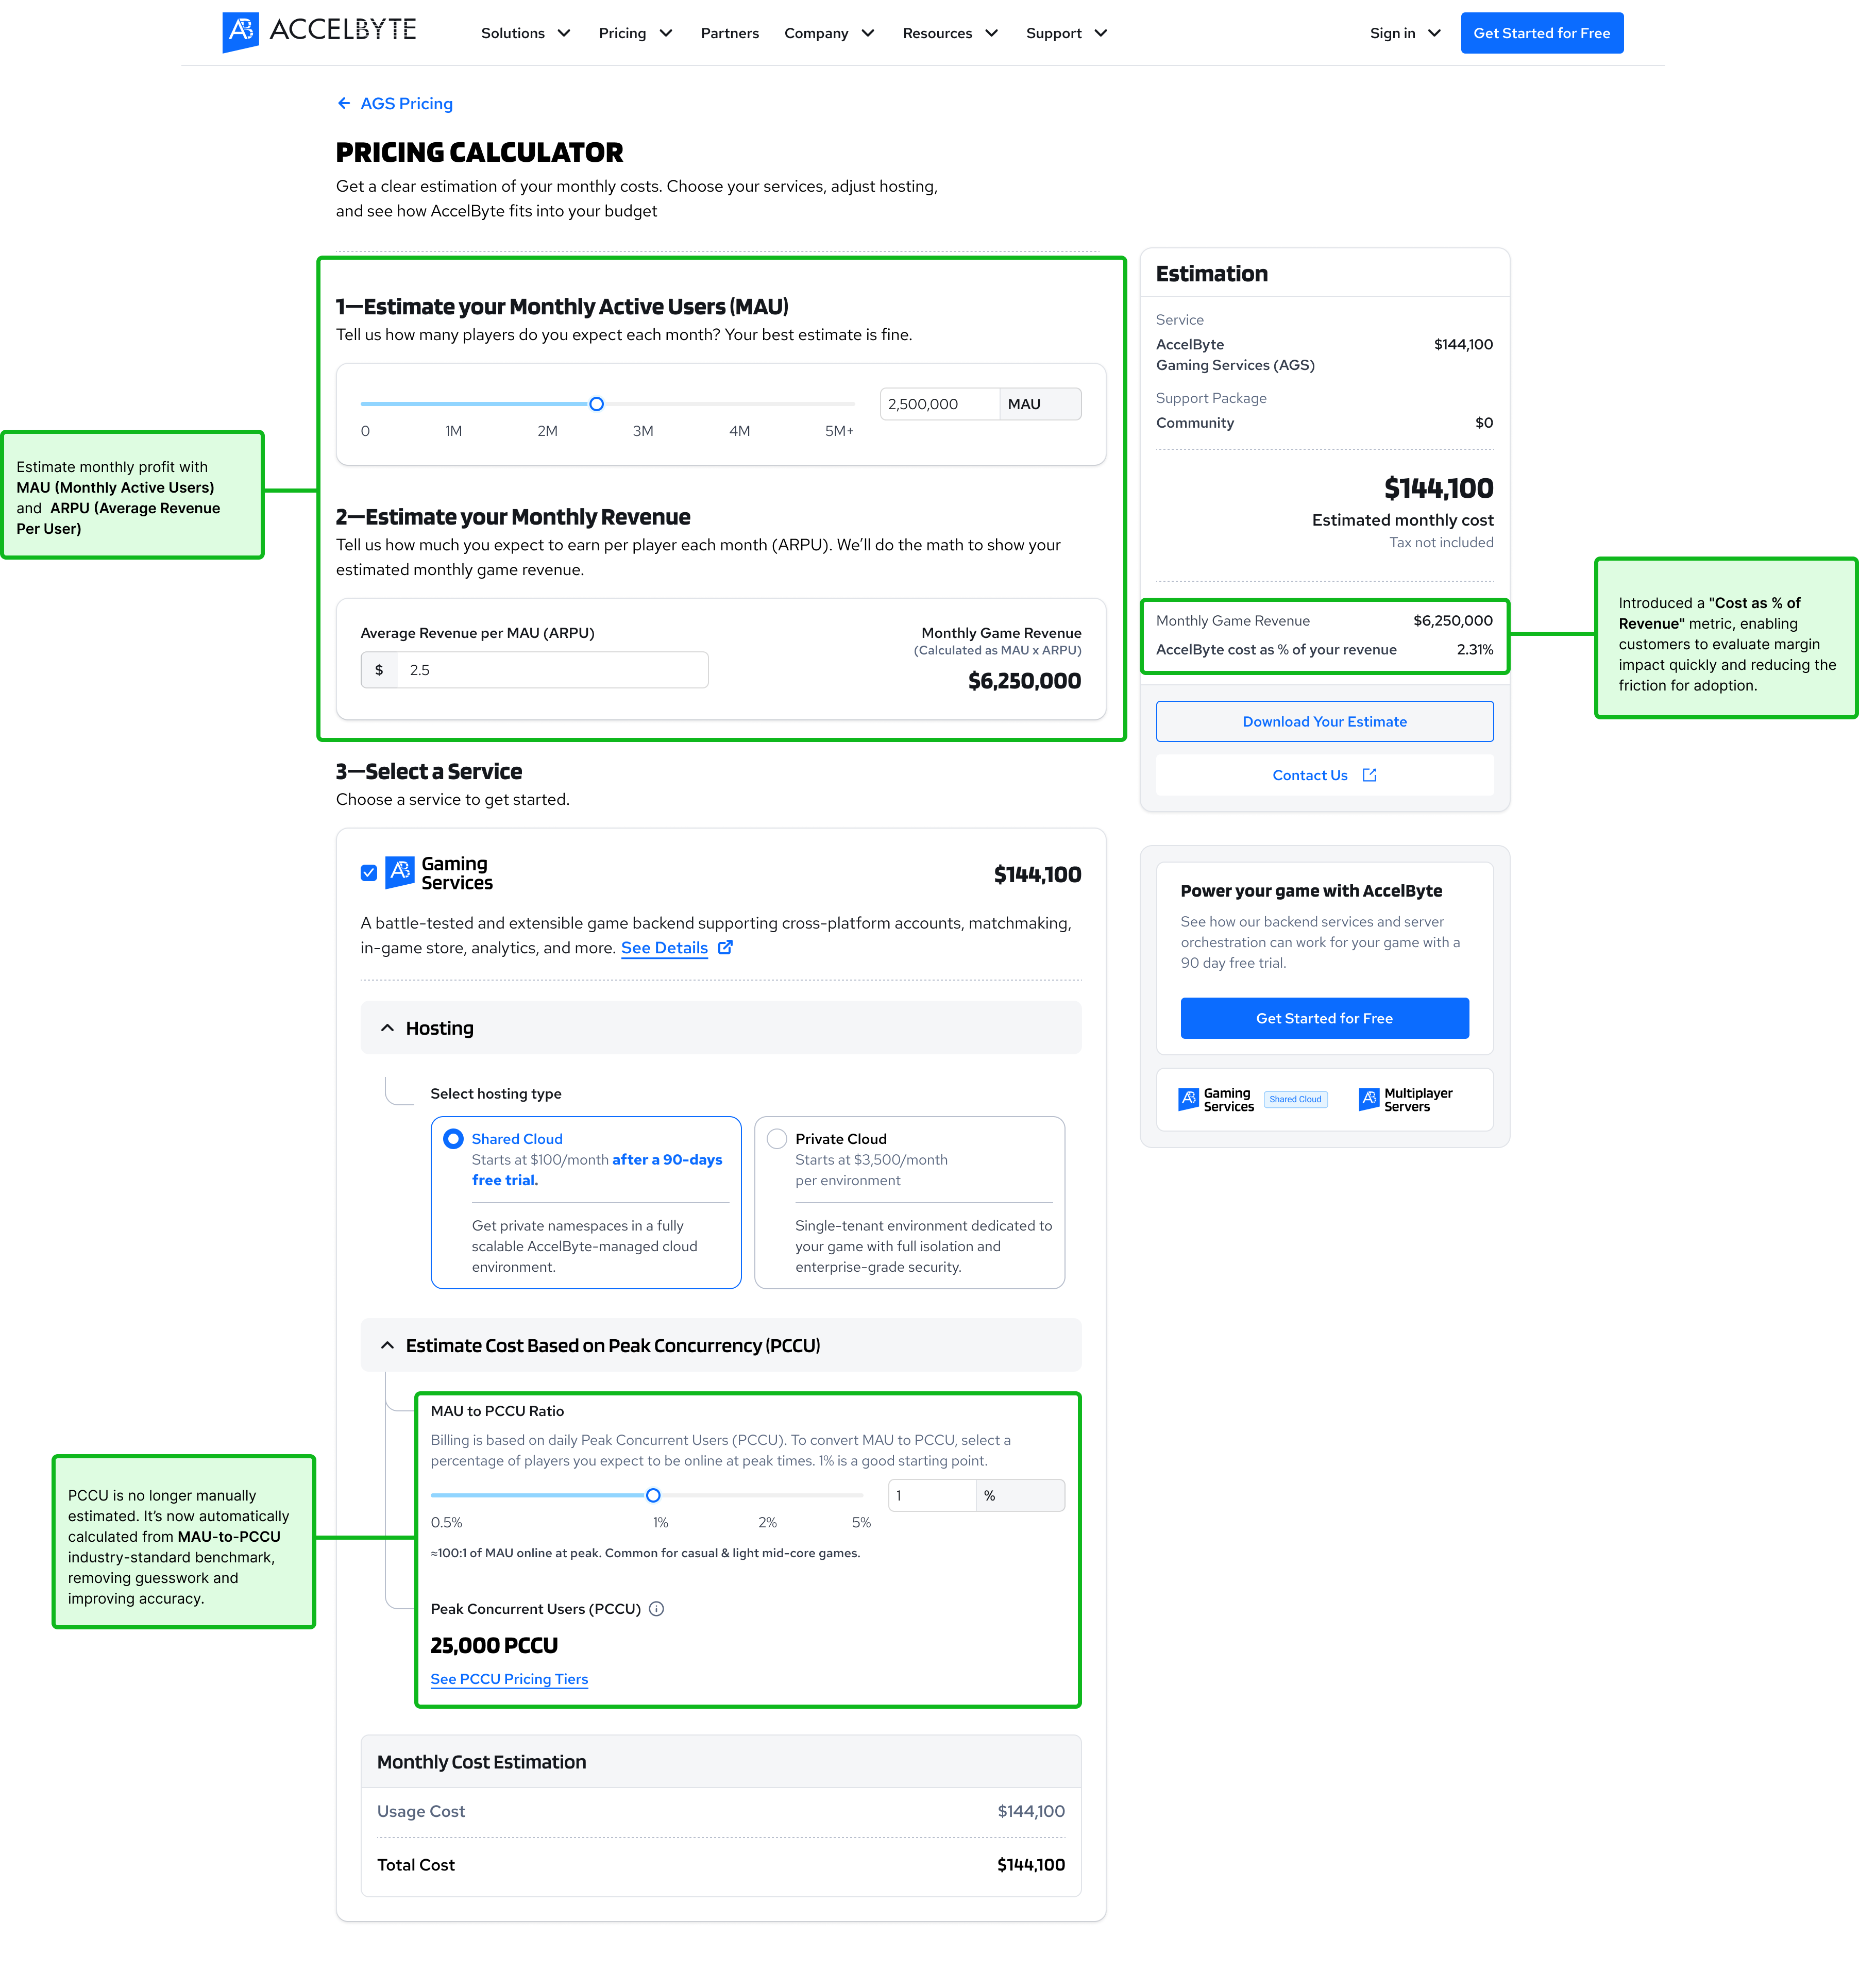
V1 - Making Sense the Calculation
Derive, Don’t Guess
Replaced manual PCCU estimation with industry-standard ratios for data-driven accuracy.
Cost in Business Languages
Replaced financial guesswork with ARPU-driven projections and transparent cost-to-revenue modeling.
IA & Microcopy Clarity
Restructured the calculator flow into a logical three-step progression: User Traffic, Monthly Revenue, and Service Selection.
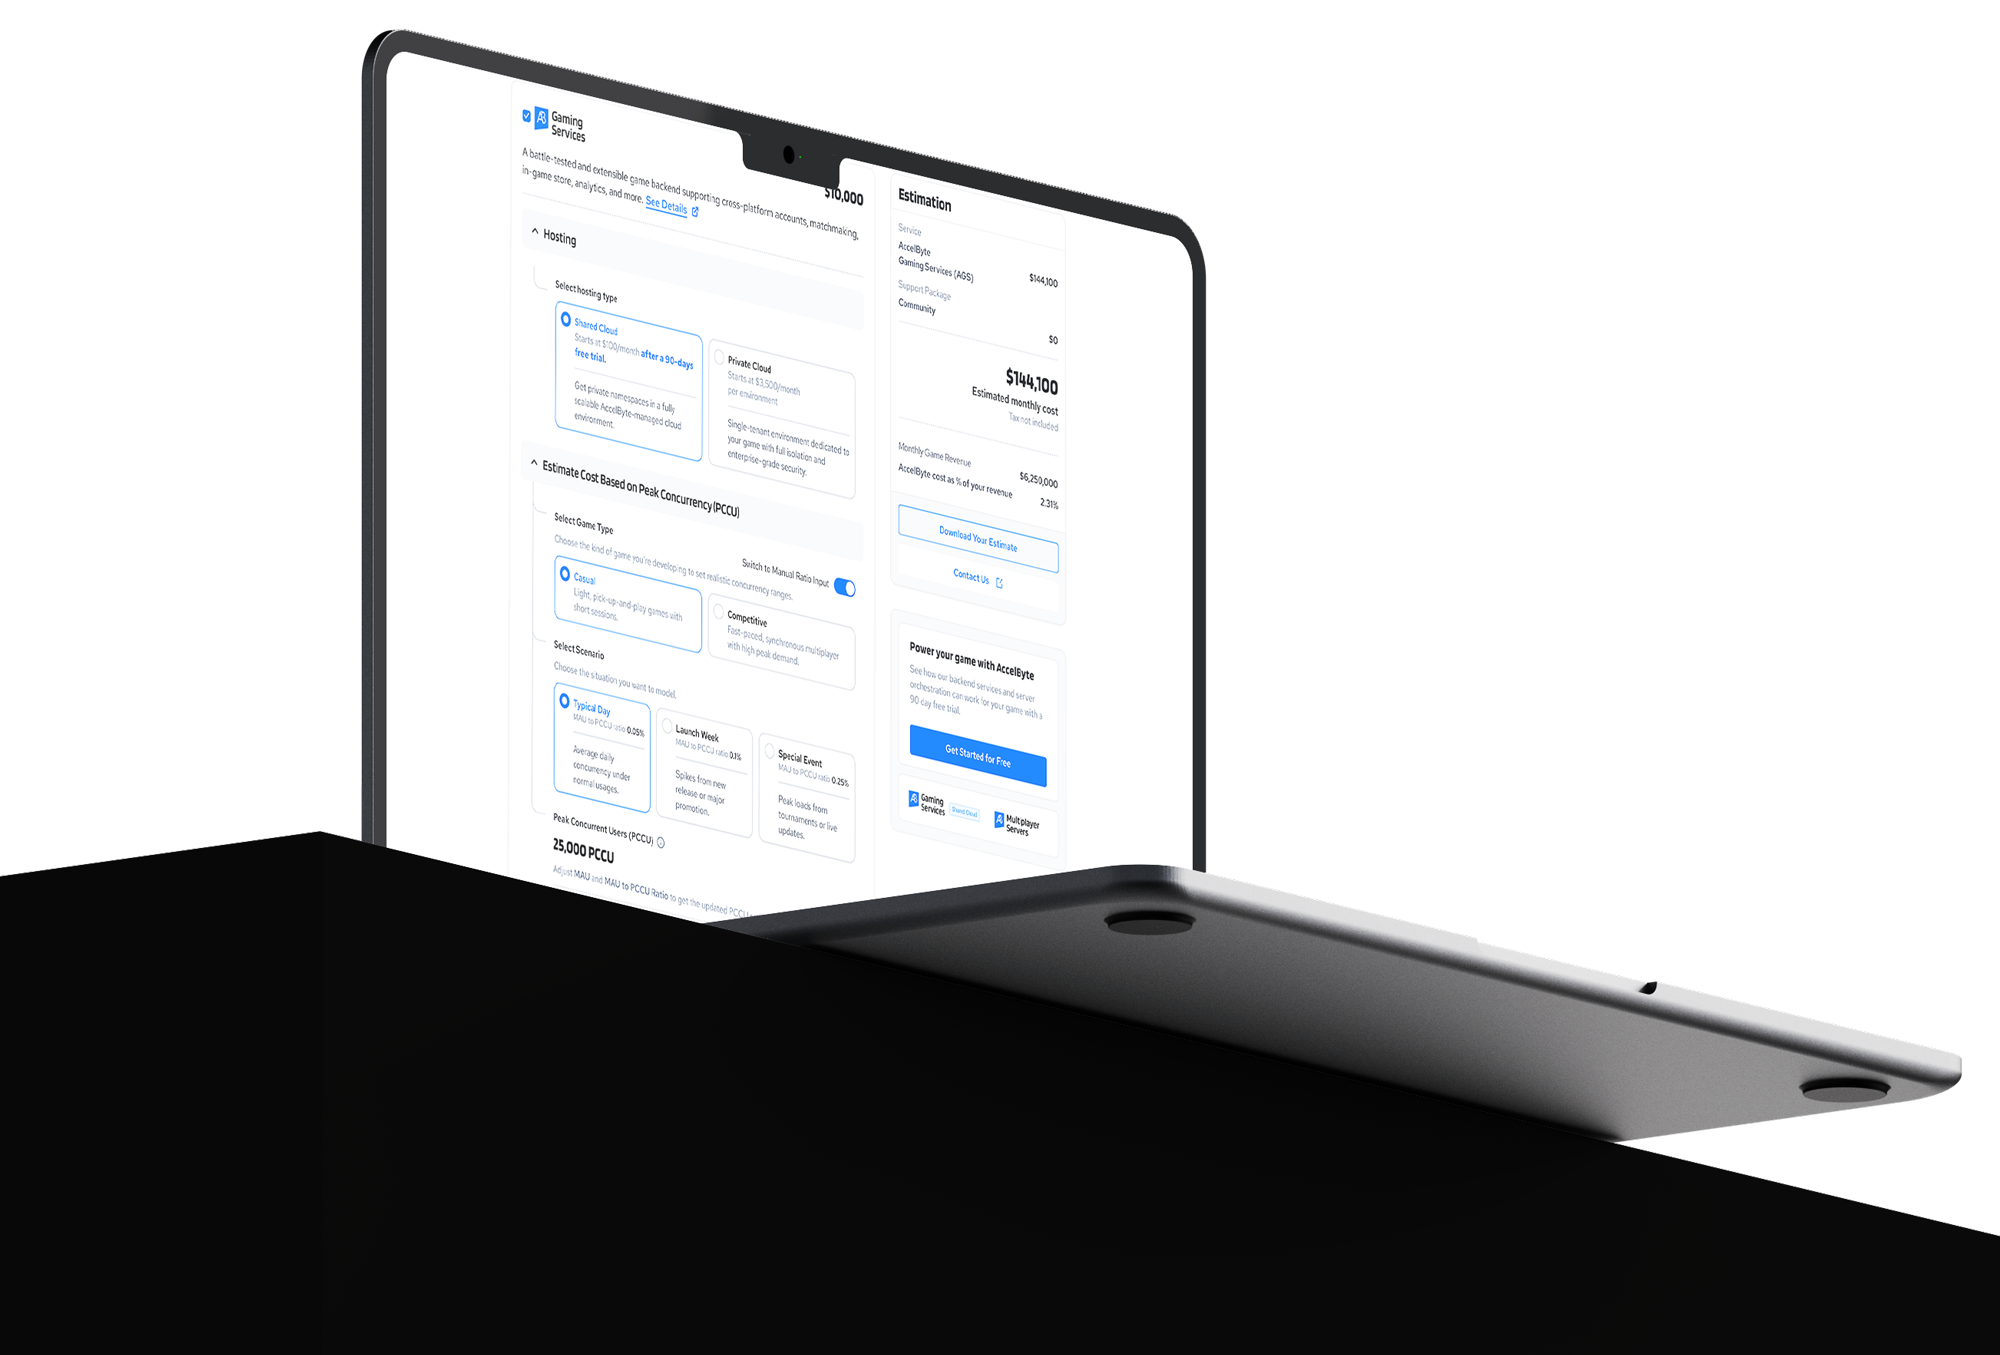
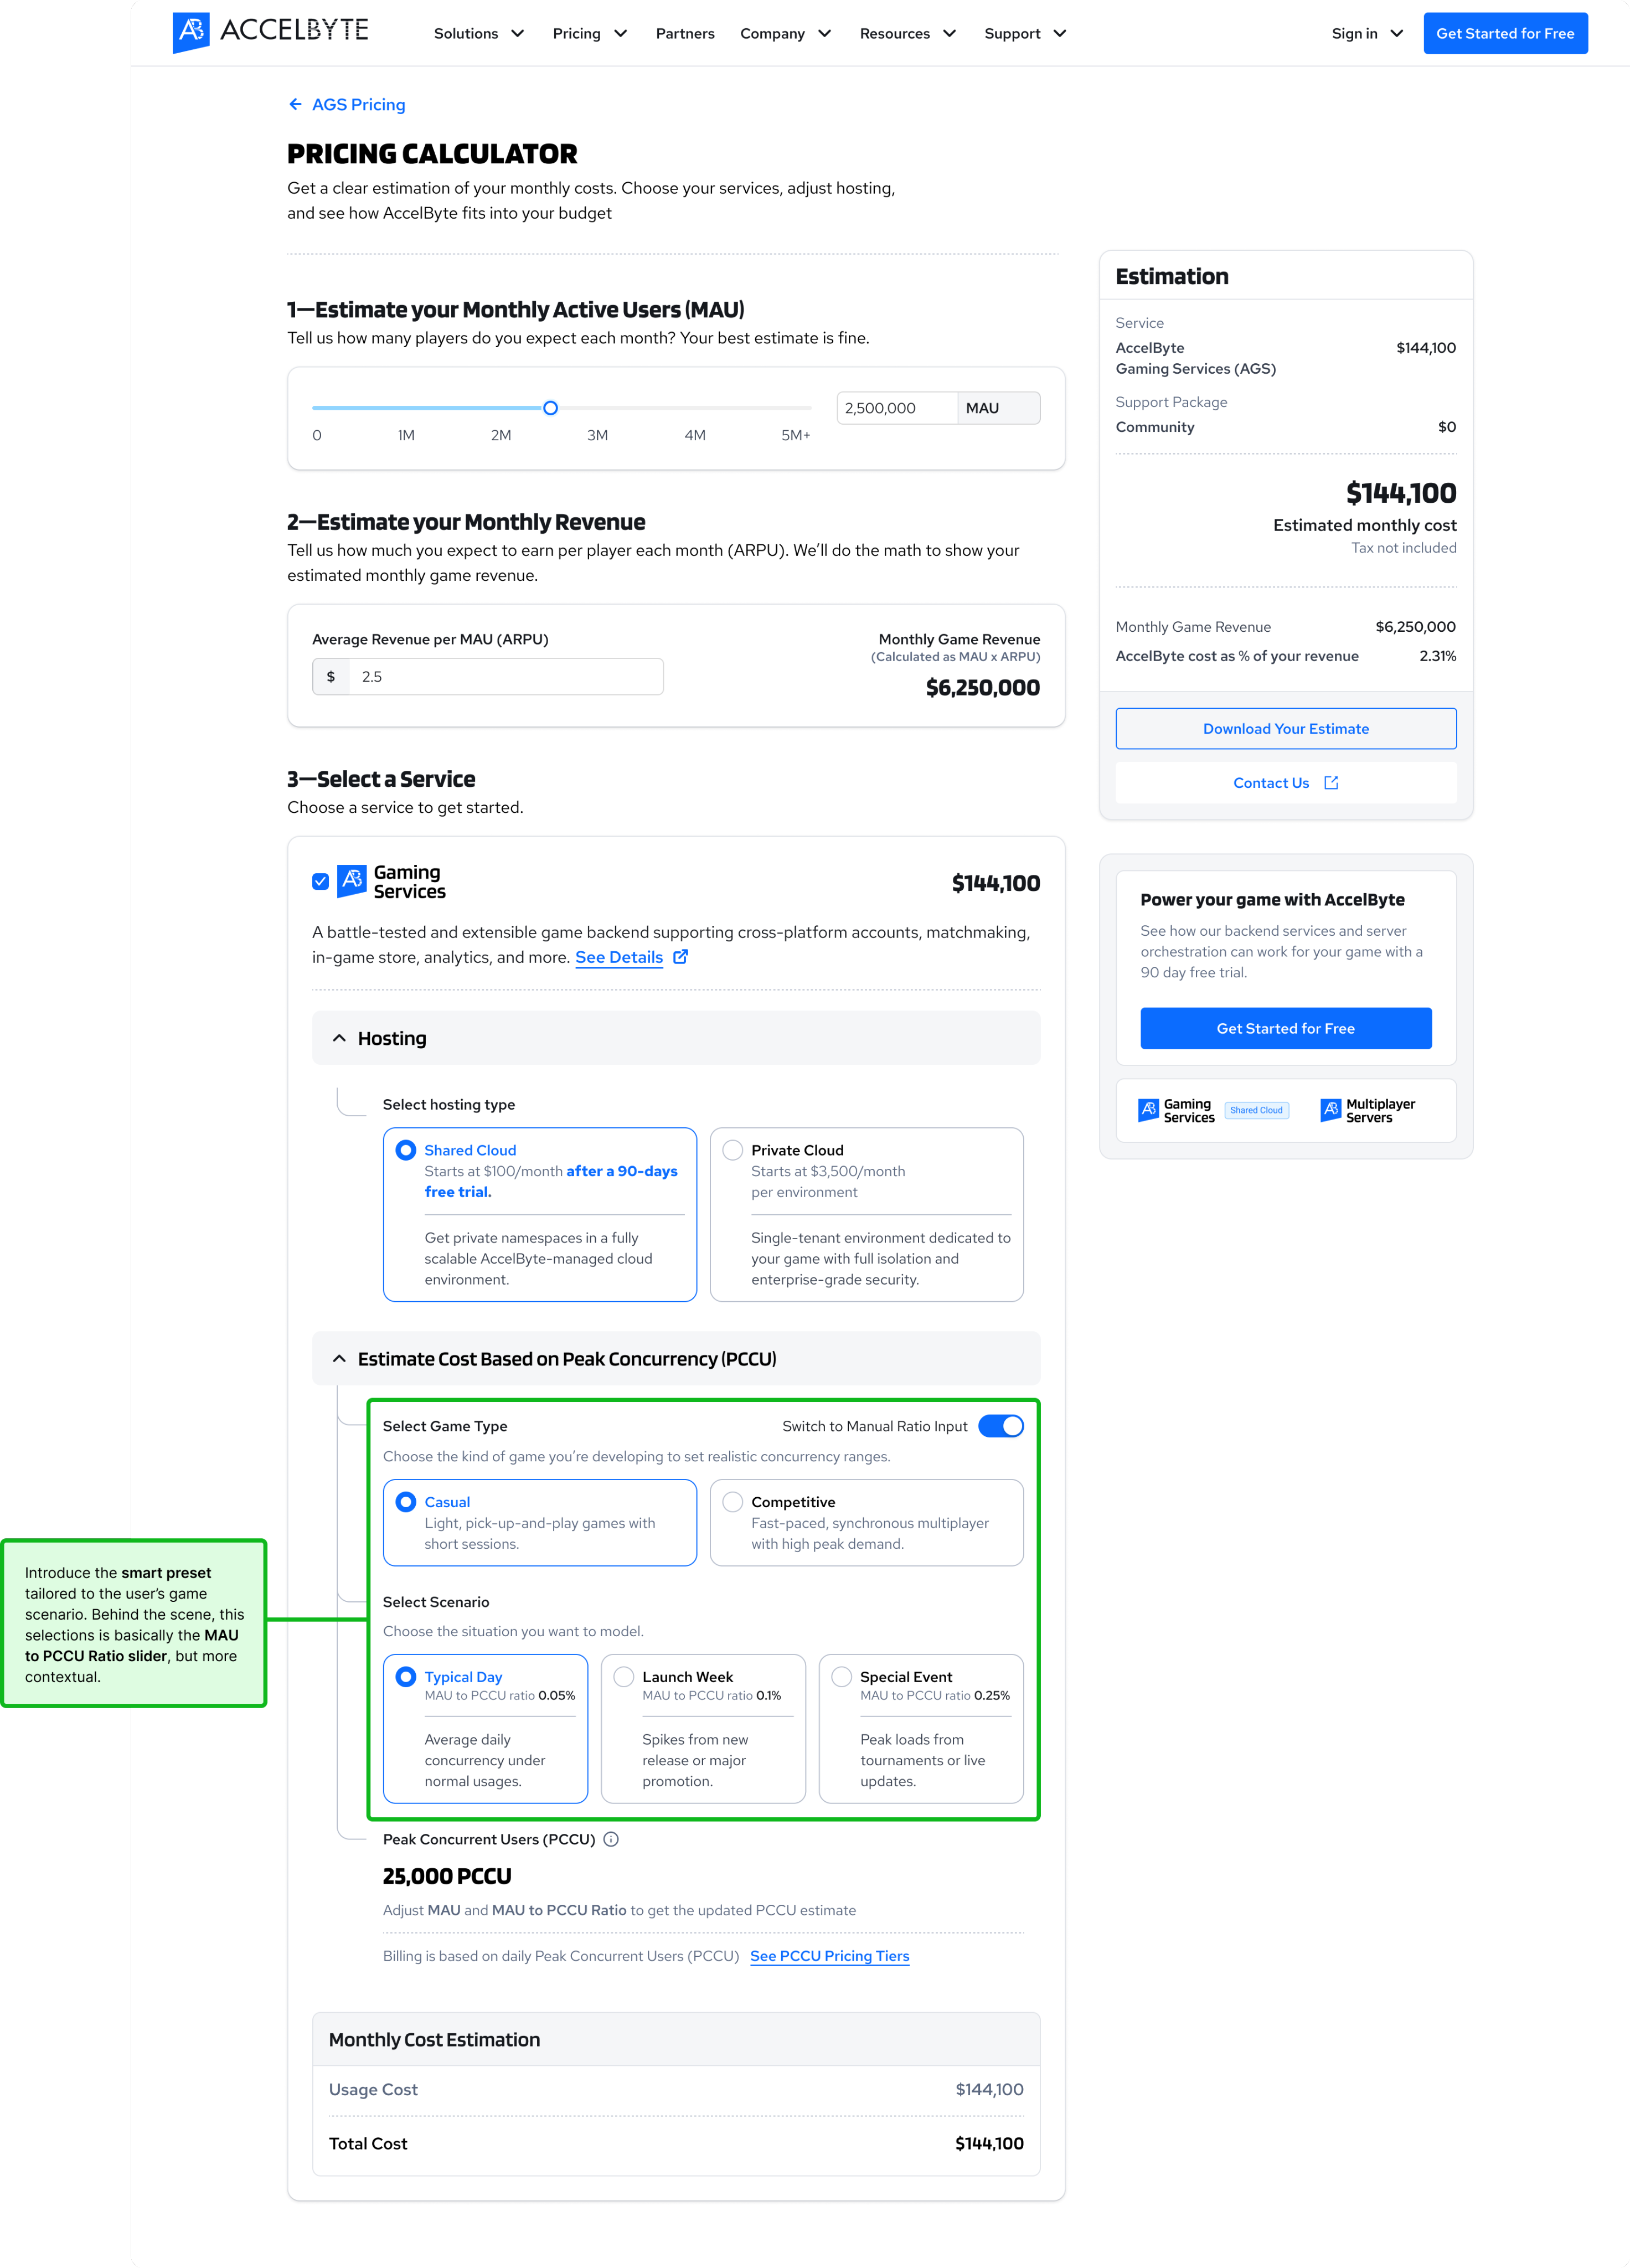
V2 - Introduce Smart Presets
Smart presets for beginners, slider for power users.
Simplified abstract technical ratios into user-friendly presets, cutting decision time and mental load for the sake of intuitive experience.
Design HAndoff
Annotation, Design Specs, & Edge Cases
I put together the design specification, present to the stakeholders, design critique, and provide a comprehensive hand-off figma file to the engineers & QA.
Impacts
- Reduced exit rate on cost calculator page.
- Increased “Download your estimate” clicks.
- Increased number of Contact Us/Book demo (CTR clicks).
Closing thought
Strategic design can drive revenue by optimizing value perception and transparency without lowering prices.
I’l be happy to walk you through the case study behind this project
I am available for an online conversation at your convenience to explore potential roles and how I can add value to your organization.


✦ Back to Homepage
Making sense scary-high cost estimates into transparent forecast
My Roles:
Product Designer
Team:
PM, Solution Architects, Sales Ops, Designer, and Engineering
Timeline:
2025 (3 months)
Context
I redesigned the cost estimation of Peak Concurrent Users (PCCU) that is generating scary-high totals and sales friction, into a clearer math, confident, and explainable forecast.
Game studios who interested to onboard with AccelByte services, they need to evaluate backend & server orchestration costs in our pricing calculator to estimate their infrastructure usages based on the game’s Peak Concurrent Users (PCCU).
problem
The old pricing calculator asked users to enter PCCU directly. For many game studios, especially early stage, this is an abstract metric, Peak Concurrent Users (PCCU) is hard to estimate in isolation.
Goal
How might we make it explainable by helping customers estimate the cost that makes sense?
Define success metrics:
- Lowering drop-off on the pricing calculator page.
- Increasing the “Download Estimate” conversions.
- Let users compare cost to revenue to judge margin impact.
- Contact Sales CTA after realistic estimates.
The “Why” behind the number
People are more certain about Monthly Active Users (MAU). The context can generates a more measured PCCU.
Contextual benchmaring
Introduce a MAU-to-PCCU ratio (with common ranges) makes the relationship visible and adjustable.
Financial context
Compare AccelByte spend to user’s revenue to understand margin impact by showing Cost as % of Revenue.
Guardrail the extremes
Offer "Talk to Sales" guidance when estimates reach extreme scales.
Strategic Framing
Instead of asking, "What is your PCCU?", the UI should ask:
"How many players do you expect to have online at the same time during your busiest hour?"
Solutions
We simplified the technical complexity by grounding the calculator in business-centric language and industry benchmarks.
Design Process
Here’s how the design evolves with countless iterations.
The Problematic Design
While the interaction only requires adjusting a single slider, the resulting PCCU spikes can result in high, 'scary' cost projections that causes user drop-off.
V0 - Temporarily Hide from Public
We temporarily hide the pricing calculator from public to avoid more damage caused, while we’re cooking the improved version.
V1 - Making Sense the Calculation
Derive, Don’t Guess
Replaced manual PCCU estimation with industry-standard ratios for data-driven accuracy.
Cost in Business Languages
Replaced financial guesswork with ARPU-driven projections and transparent cost-to-revenue modeling.
IA & Microcopy Clarity
Restructured the calculator flow into a logical three-step progression: User Traffic, Monthly Revenue, and Service Selection.
V2 - Introduce Smart Presets
Smart presets for beginners, slider for power users.
Simplified abstract technical ratios into user-friendly presets, cutting decision time and mental load for the sake of intuitive experience.
Design HAndoff
Annotation, Design Specs, & Edge Cases
I put together the design specification, present to the stakeholders, design critique, and provide a comprehensive hand-off figma file to the engineers & QA.
Impacts
- Reduced exit rate on cost calculator page.
- Increased “Download your estimate” clicks.
- Increased number of Contact Us/Book demo (CTR clicks).
Closing thought
Strategic design can drive revenue by optimizing value perception and transparency without lowering prices.
I’l be happy to walk you through the case study behind this project
I am available for an online conversation at your convenience to explore potential roles and how I can add value to your organization.
✦ Back to Homepage
Making sense scary-high cost estimates into transparent forecast
My Roles:
Product Designer
Team:
PM, Solution Architects, Sales Ops, Designer, and Engineering
Timeline:
2025 (3 months)
Context
I redesigned cost estimation that is generating scary-high cost, into an explainable, data-driven forecast.
Game studios who interested to onboard with AccelByte services, they need to evaluate backend & server orchestration costs in our pricing calculator to estimate their infrastructure usages based on the game’s Peak Concurrent Users (PCCU).
problem
Early-stage studios struggled to provide PCCU metrics, leading to inaccurate cost estimation and drop-offs.
Goal
How might we make it explainable by helping customers estimate the cost that makes sense?
Define success metrics:
- Lowering drop-off on the pricing calculator page.
- Increasing the “Download Estimate” conversions.
- Let users compare cost to revenue to judge margin impact.
- Contact Sales CTA after realistic estimates.
Strategic Framing
Instead of asking, "What is your PCCU?", the UI should ask:
"How many players do you expect to have online at the same time during your busiest hour?"
Solutions
We simplified the technical complexity by grounding the calculator in business-centric language and industry benchmarks.
The “Why” behind the number
People are more certain about Monthly Active Users (MAU). The context can generates a more measured PCCU.
Contextual benchmaring
Introduce a MAU-to-PCCU ratio (with common ranges) makes the relationship visible and adjustable.
Financial context
Compare AccelByte spend to user’s revenue to understand margin impact by showing Cost as % of Revenue.
Guardrail the extremes
Offer "Talk to Sales" guidance when estimates reach extreme scales.
Design Process
Here’s how the design evolves with countless iterations.
The Problematic Design
While the interaction only requires adjusting a single slider, the resulting PCCU spikes can result in high, 'scary' cost projections that causes user drop-off.
V0 - Temporarily Hide from Public
We temporarily hide the pricing calculator from public to avoid more damage caused, while we’re cooking the improved version.
V1 - Making Sense the Calculation
Derive, Don’t Guess
Replaced manual PCCU estimation with industry-standard ratios for data-driven accuracy.
Cost in Business Languages
Replaced financial guesswork with ARPU-driven projections and transparent cost-to-revenue modeling.
IA & Microcopy Clarity
Restructured the calculator flow into a logical three-step progression: User Traffic, Monthly Revenue, and Service Selection.
V2 - Introduce Smart Presets
Smart presets for beginners, slider for power users.
Simplified abstract technical ratios into user-friendly presets, cutting decision time and mental load for the sake of intuitive experience.
Design HAndoff
Annotation, Design Specs, & Edge Cases
I put together the design specification, present to the stakeholders, design critique, and provide a comprehensive hand-off figma file to the engineers & QA.
Impacts
- Reduced exit rate on cost calculator page.
- Increased “Download your estimate” clicks.
- Increased number of Contact Us/Book demo (CTR clicks).
Closing thought
Strategic design can drive revenue by optimizing value perception and transparency without lowering prices.
I’l be happy to walk you through the case study behind this project
I am available for an online conversation at your convenience to explore potential roles and how I can add value to your organization.